
You finally got a Qwen model running. Congratulations. Now comes the part most tutorials skip: figuring out whether it is actually useful for your work.
Tokens per second looks impressive in a screenshot. A single cherry-picked prompt can make almost any model look smart. Vendor cards claim broad capability. None of that answers the only question that matters when you are trying to ship something:
Will this setup do the job I need, on the hardware I have, at a cost and maintenance burden I can live with?
This article is a practical checklist. It is not a set of published benchmark numbers. It is a repeatable process you can run yourself, document cleanly, and revisit when a new quantization, a new model size, or a new hardware option appears. The goal is simple: turn vague “it feels good” impressions into decisions you can defend.
Make it run. Make it useful. Evaluation is how you close the gap between those two sentences.
Who This Checklist Is For
This is written for developers and small teams who already know how to pull a model and start a local server. You have probably tried Ollama, llama.cpp, or an OpenAI-compatible endpoint. You can write a Python client. What you lack is a consistent way to compare options without turning every weekend into an uncontrolled experiment.
If you are still deciding whether local inference makes sense at all, start with the earlier pieces on hardware checklists and basic installation. This checklist assumes you can already get a response back from a model. Now we make that response measurable.
The Core Principle: Separate What You Measured from What You Assume
Before any numbers appear, write three short statements for every evaluation run:
What was actually measured (hardware, software versions, prompts, metrics, number of trials).
What was inferred or estimated (cost projections, long-context behavior under load you did not simulate, quality judgments based on limited samples).
What remains untested.
This single habit prevents most of the noise that fills model discussion threads. It also keeps the fictional author persona honest: no invented lab results, no claimed client deployments, no “on my machine” numbers that never existed. Everything below is a template and a method, not a data dump.
1. Define the Task Before You Touch the Model
A benchmark without a task is just a speed test. Start by writing a one-paragraph task description that a colleague could understand.
Examples of useful task statements:
“Extract structured JSON for invoice fields from 200–400 token documents with 95 % field-level accuracy and recover gracefully on missing fields.”
“Answer questions over a 50-document internal knowledge base using RAG; prioritize factual grounding over fluency.”
“Generate short Python functions from natural-language descriptions and pass a fixed unit-test suite.”
“Maintain coherent multi-turn tool-calling conversations of 8–12 turns without losing earlier constraints.”
Bad task statements look like “be good at coding” or “handle long context.” Those invite cherry-picking.
Once the task is clear, list the success criteria in plain language. Accuracy thresholds, latency budgets, memory ceilings, and cost limits all belong here. If you cannot state them, you are not ready to evaluate.
2. Lock the Environment
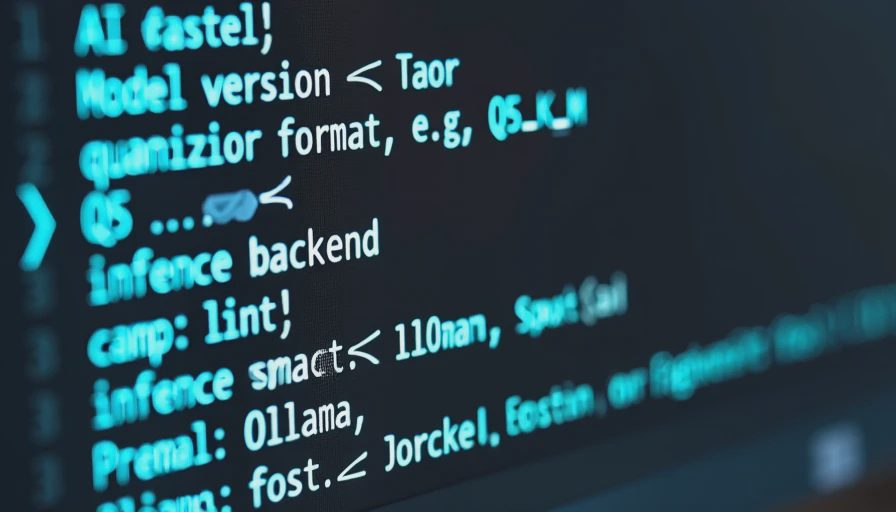
Reproducibility dies when the environment drifts. Record the following for every run and treat the record as part of the result:
Exact model identifier and quantization (e.g., Qwen2.5-7B-Instruct-Q5_K_M, GGUF).
Inference stack and version (Ollama 0.x.y, llama.cpp commit hash, vLLM version, etc.).
Hardware: GPU model and VRAM, CPU model and core count, system RAM, storage type if relevant.
Operating system and key library versions (CUDA, PyTorch, etc. if applicable).
Context length setting, temperature, top-p, and any other sampling parameters.
Batch size or concurrency level used during measurement.
Date of the run and any known external factors (thermal throttling, background processes).
A simple markdown table or a short YAML block is enough. The point is that six months later you (or a teammate) can recreate the conditions closely enough to trust a comparison.
3. Choose Metrics That Match the Task
Tokens per second is useful. It is almost never sufficient.
Speed and Resource Metrics
Prefill latency (time to first token for a representative prompt length).
Decode speed (tokens per second after the first token).
Peak VRAM or system RAM during generation.
Tokens per second under concurrent load if you expect more than one user or process.
Cold-start time if the model is loaded on demand.
Quality Metrics
Define these against your task, not against a general leaderboard.
Exact-match or field-level accuracy for structured output.
Pass rate on a fixed unit-test or evaluation set for code generation.
Faithfulness and relevance scores for RAG (even simple human binary judgments on a small set are better than nothing).
Tool-call success rate: correct tool selected, correct arguments, successful recovery after an error.
Consistency across temperature or sampling variations if determinism matters.
Operational Metrics
Failure rate and recovery behavior (timeouts, malformed JSON, context overflow).
Maintenance friction: how often the setup needs attention after the initial install.
Cost per successful task (local electricity estimate or cloud GPU hours, plus your time).
When you publish or share results, always pair the number with the exact conditions. “42 tokens/s” without model size, quantization, hardware, and prompt length is marketing, not measurement.
4. Build a Small, Fixed Evaluation Set
Random prompts produce random conclusions. Create a modest, version-controlled set of inputs that represent the real work.
Practical guidelines:
Start with 20–50 examples. More is better only if you can keep them stable.
Include easy cases, hard cases, and known edge cases (empty fields, contradictory instructions, long documents that approach the context limit).
For structured output, keep a gold JSON or schema for each example.
For RAG, keep the same retrieval corpus and the same question set.
For tool calling, script the expected tool sequence and arguments.
Store the set in a repository. Treat changes to the evaluation set as version bumps. When you later compare a new quantization, you want the only variable to be the model, not a drifting test suite.
I have watched more than one weekend disappear because someone “improved” the prompts midway through a comparison. Lock the set first.
5. Run the Comparison Protocol
A clean protocol looks roughly like this:
Warm up the model with a few dummy generations so cold-start effects are excluded from the main measurements.
Run the full evaluation set at least three times if the metric is noisy (speed under load, sampling-dependent quality).
Record both mean and variance or range. A single high token/s number is less informative than a range under realistic conditions.
Capture failure modes separately: which prompts broke, how they broke, and whether the system recovered.
Note any thermal or resource throttling that appeared during longer runs.
If you change one variable (quantization, context length, concurrent requests), change only that variable and keep everything else identical.
Document the protocol in the same place as the results. Future-you will thank present-you.
6. Interpret Results with Trade-offs Explicit
Numbers without trade-offs are incomplete.
A 7B Q5 model that fits comfortably in 8 GB of VRAM and still passes 90 % of your structured-output tests may be more useful than a 32B model that requires an expensive GPU and only gains another 4 % on the same set. The checklist forces you to write the comparison in those terms:
Speed versus memory.
Quality versus cost.
Local privacy and latency versus hosted convenience and maintenance.
Context length versus actual usefulness on your documents.
Complexity of the stack versus time to first successful task.
When a result looks surprising, ask whether the evaluation set or the success criteria need adjustment. Sometimes the model is fine and the test is measuring the wrong thing.

7. Cost and Maintenance Reality Check
Local inference is not free. Cloud APIs are not free either. The checklist should include a short cost section even if the numbers are estimates.
For local:
Approximate electricity cost for the observed runtime (or simply note that it is low enough to ignore for occasional use).
Opportunity cost of the hardware if it is also used for other work.
Time spent on setup, troubleshooting, and version upgrades.
For hosted:
Token or request pricing at the volumes you actually expect.
Latency and rate-limit behavior under your load pattern.
Data residency and privacy constraints that may rule an option out regardless of price.
Maintenance is the hidden variable. A setup that requires weekly babysitting is more expensive than a slightly slower one that runs for months with only occasional attention. Record how much intervention the stack needed during the evaluation period.
8. When to Stop and Choose
Evaluation can become its own form of procrastination. Set a stopping rule in advance.
Reasonable stopping conditions:
You have tested the two or three most plausible model + quantization + hardware combinations against the same fixed set.
The leading option meets the success criteria with acceptable cost and maintenance.
Additional options are unlikely to change the decision by more than a small margin.
The time spent evaluating is starting to exceed the value of the improvement.
At that point, write a one-paragraph decision note: chosen stack, key measured numbers, known limitations, and the conditions under which you would reopen the evaluation (new model family, significant hardware change, task evolution).
Then ship.
A Minimal Checklist You Can Copy
Here is a condensed version you can paste into a notebook or issue tracker:
Task and success criteria
One-paragraph task description
Explicit success metrics and thresholds
Environment lock
Model ID + quantization
Inference stack + versions
Hardware description
Sampling parameters and context length
Evaluation set
Fixed, versioned set of 20+ representative examples
Gold answers or automated checks where possible
Metrics collected
Speed (prefill + decode)
Peak memory
Task-specific quality
Failure modes and recovery
Cost and maintenance notes
Protocol
Warm-up performed
Multiple runs if needed
Only one variable changed between comparisons
Results labeled as measured / inferred / untested
Decision
Trade-offs written down
Stopping rule applied
One-paragraph decision recorded
Practical Conclusion
Reproducible evaluation is less glamorous than a new model release, but it is the difference between a setup that feels promising and a setup you can trust for real work. The checklist above does not replace careful testing; it structures the testing so the results remain useful after the excitement fades.
Start with the task. Lock the environment. Measure what matters for that task. Write down the trade-offs. Stop when the decision is clear enough to act on.
That is how you move from “it runs” to “it is useful.” And that is the only benchmark that ultimately counts.
Make it run. Make it useful.



No comments yet — be the first to share a thought.